What's new
VORON Design

Register a free account today to become a member! Once signed in, you'll be able to participate on this site by adding your own topics and posts, as well as connect with other members!

Stepper Motor Dyno Build Log

eddie

Member
Staff member
Voron Owner
Follow along as I build a stepper motor dyno!

If you're following my YouTube channel, I have content on figuring out which stepper motor is best for you (with a theoretical model):

With the theoretical model accessible here:

In addition, I have a video where I start to look at how much power stepper motors consume, which is helpful for choosing a power supply.

The next logical step is to create a stepper motor dyno, where I can directly measure the stepper motor performance while iterating through a large variety of parameters. This setup needs to be automated! For an example of how many points I plan on measuring for a single motor:

Inputs:
Stepper Motor Model: (ie, 17HS19-2004S1)
Stepper Driver (TMC5160, etc)
Stepper Driver Voltage (12, 24, 36, 48V)
Stepper Driver Microstepping: (2, 4, 8, 16, 32, 64, 128)
Stepper Driver Interpolation/Stealthchop: (Off/Off, On/Off, On/On)
Stepper Driver Current Target: (0.5, 0.6, 0.7, 0.8, 0.9, 1.0, 1.1, 1.2, 1.3, 1.4)
Torque Load (0-100% of theoretical max, 10% increments)
Speed (20-1400mm/s, in 20mm/s increment)

Combining these variables, we have approximately 1 * 1 * 4 * 7 * 3 * 10 * 11 * 70 = 646800 tests per motor

Of course--we can't do this many tests realistically, since at 5 seconds per test, that would be 37 days of tests! Fortunately, we won't have 70 speeds per test since some won't be able to run (ie, 12V at 1400mm/s likely won't run!) so we can skip tests above those thresholds.

What do we want to know from each test?

Outputs:
1. Driver Input (Volts, Amps, Watts)
2. Stepper Motor Input (Volts, Amps, V_rms, A_rms, Oscilloscope Waveform)
3. Stepper Motor Output (RPM, Torque, Power)
4. Stepper Motor Resonances (dBa, FFT Hz of peak)

First of, by knowing what the driver input characteristics are, we can properly spec power supplies across a wide range of operating conditions! Knowing the stepper motor input, we can understand how effectively the stepper driver is controlling the stepper motor--how the backemf from the stepper motor causes the actually supplied current to fall off with increasing speed. Knowing the stepper motor output, we can plot the actual torque and power from the stepper motor! As well, with enough encoder resolution, we can see if there's any issues with stepper motor accuracy as speed increases. Finally, (hopefully), with a microphone, we can identify what settings cause increased noise, and also what stepper motors are quietest!

Current Status:
Completed:
-Python code to iterate through Input Voltage, Driver Current, Speed
-Oscilloscope logging (Voltage/Current) at each point
-Python Plot of oscilloscope trace for 4 full steps
-CSV file logging

In Progress:
-Load Cell integration
-Mechanical assembly
-BLDC motor (stepper motor resistance) control
-Update oscilloscope logging from BitScope Micro to Siglent model

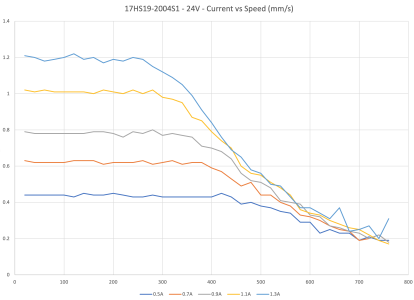
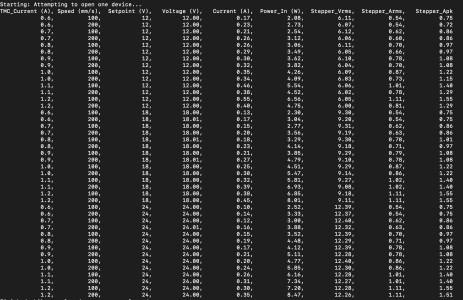
Here's a sample!


1668273920118.png

1668273945766.png

1668273968712.png
 
Last edited:
Hello everyone!

It's time for another update. The last few weeks I've put a ton of time into this, and most of it's due to me gradually learning python which has been slow but rewarding.

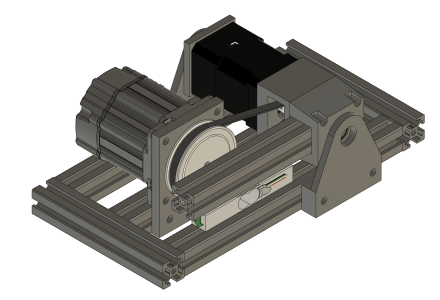
I finally 3d printed the structural parts for the dyno! You can see the BLDC motor on the left, which for now isn't really doing much, but in the future will be a programmable load for the stepper motor. I'm still not sure how that will work--the Texas Instruments programs are pretty much Windows/x86 only, and I'll need to interface with the control board via the Raspberry Pi/USB. That's a problem for future me :)

img


In the center, the stepper motor is mounted on a freely rotating pivot. An extrusion extends from the center of the stepper axis to the right, which applies a force on the 1kg load cell at a specific distance from the stepper axis. Here we can measure the torque of the stepper motor. This part is working fairly well--the last two columns here show the torque output from the stepper motor (force * moment arm). The last column, Motor_Power, is the mechanical power in watts that the stepper motor is actually outputting (Torque * Speed). The numbers in this calculation below for power weren't quite correct, but at least it's partially working!

img


You can also see here where the torque dropped to 0 at 800mm/s! This, combined with future encoder feedback, will allow us to detect when the motor stalls, which will allow us to skip test points that the motor can't hit. One more note--right now the Torque output is only due to the phases of the BLDC motor being tied together--so the BLDC motor isn't actively trying to hold a specified torque during each test. That will have to come at a later date!

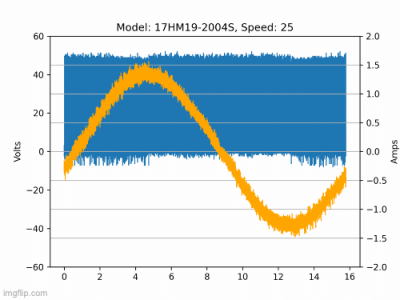
I did run into some issues with the Bitscope USB oscilloscope interfering with my Riden power supply, so with $$$ and a lot of PyVisa assistance from Thebrakshow, I have a new Siglent SDS1104X-E oscilloscope integrated into the stepper tester. Instead of 12000 samples per plot, we can capture over 500,000! Part of the fun has been adjusting the scope configuration per test point in order to maximize the resolution.

I started out with the voltage and current on channels 1 and 2, but will be changing them to channels 1 and 3 since the SDS1104X-E can maintain full sample rate on two channels as long as they are split between 1/2 and 3/4! The plot below is still with 1/2 the resolution at higher speed points.


721ypi.gif
The other component of this that is important is timing! Since we are looking at potentially hundreds of thousands of test points, the time for each point is critical. I spent some time working on threading the data capture portion of each sequence, since capturing data sequentially takes a long time! Here's an example of 5 test points without threading:

img


And here's the same test points, with threading:

img


Since these tests, the cycle time has increased since I'm capturing more data with the oscilloscope (10k to ~100k-1M samples), but this is a huge improvement nonetheless.

What's next?

Once I have the oscilloscope sampling updated, next step will be to add the encoder feedback! This will be the most reliable way to determine when the motor has stalled. Then, I want to work some more on data processing. With even the current setup, so much data is being generated that having graphs auto generated per data point (oscilloscope plots) as well as summaries per motor (current/power vs. speed and voltage) will be critical to save time. At that point, I'll likely try and do some bigger test sweeps and present the data I have!

The final big piece is still the BLDC torque conttrol--that will be another big effort :) but that's for another day.
 
That’s super impressive! It’s been interesting to see more testing like this pop up in the community recently. Is there a list of the motors you’re going to test anywhere?
 
That’s super impressive! It’s been interesting to see more testing like this pop up in the community recently. Is there a list of the motors you’re going to test anywhere?
that's a great question! I have a lot of motors in my bin, maybe 20-30 different models. I'll have to compile a list!
 
Another quick update today on some progress!

First off, I have a basic function now that reads through the printer config file, finds the line that defines the micro steps for the motor, and then updates the micro steps to the desired setting. I haven't included this in the loop functions yet, but I hope to soon! My current set of tests (24, 36, 48V), (0.6, 0.8, 1.0, 1.2, 1.4A), (Speeds in 25mm/s increments until stall) takes around 90 minutes to complete. I think I may do something like (2, 4, 16, 128) micro stepping, and maybe add in a 12V data point, which would push it to probably 10-11 hours or so.

The tricky part is to figure out how best to present all this data! I really like the gifs for showing how the waveform changes with speed, but for each speed there are a LOT of different waveforms! I'm considering maybe making a "4" graph image, with 4 different micro stepping waveforms plotted in a gif at once, but I haven't quite decided on that. I've started transferring gif creation to the Pi, but if I try to create a gif from 500 images the Pi has RAM issues, so I may have to work on breaking up the gifs and merging them.

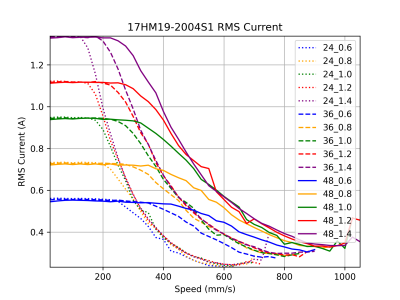
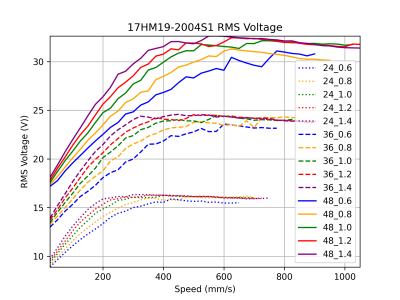
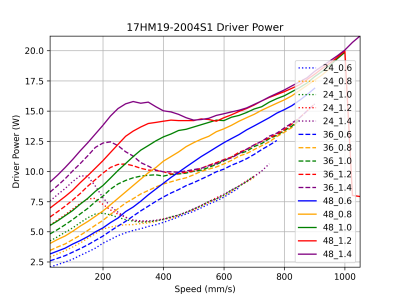
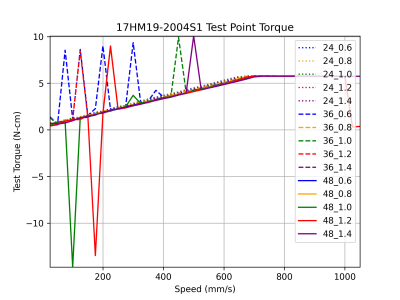
What I have gotten done is an initial way to plot all the summary data at once! This is really exciting--I have the following plots auto generating per 90 minute sequence:

17HM19-2004S1 RMS Current.png


17HM19-2004S1 RMS Voltage.png

17HM19-2004S1 Driver Power.png17HM19-2004S1 Test Point Torque.png

Definitely the test point torque doesn't really say any useful information, and I need to do some more sampling from the load cell to make sure I don't get any noise like this! But it's so exciting seeing it come together. I need to refactor this code to be more flexible, so I can adjust voltage/current settings and have it generate plots dynamically. Right now it will only work with this set of fixed voltages and currents.

With this data processing well underway, it makes me want to start working on the next steps--sound capture and torque adjustment. I'm not sure exactly how I'll do the sound capture yet, but I'll start with trying to record a basic recording a few seconds of sound. I assume it'll be pretty processing intensive to do FFT and relative sound intensity values, so that may be best to post process at the end. I do have an adapter to be able to plug a microphone into the oscilloscope and log data there, so that is one option, though it may make more sense to have some sort of USB audio interface and log wav files through that. If you have any thoughts let me know!
 
Hello everyone!

It's time for another update. The last few weeks I've put a ton of time into this, and most of it's due to me gradually learning python which has been slow but rewarding.

I finally 3d printed the structural parts for the dyno! You can see the BLDC motor on the left, which for now isn't really doing much, but in the future will be a programmable load for the stepper motor. I'm still not sure how that will work--the Texas Instruments programs are pretty much Windows/x86 only, and I'll need to interface with the control board via the Raspberry Pi/USB. That's a problem for future me :)

img


In the center, the stepper motor is mounted on a freely rotating pivot. An extrusion extends from the center of the stepper axis to the right, which applies a force on the 1kg load cell at a specific distance from the stepper axis. Here we can measure the torque of the stepper motor. This part is working fairly well--the last two columns here show the torque output from the stepper motor (force * moment arm). The last column, Motor_Power, is the mechanical power in watts that the stepper motor is actually outputting (Torque * Speed). The numbers in this calculation below for power weren't quite correct, but at least it's partially working!

img


You can also see here where the torque dropped to 0 at 800mm/s! This, combined with future encoder feedback, will allow us to detect when the motor stalls, which will allow us to skip test points that the motor can't hit. One more note--right now the Torque output is only due to the phases of the BLDC motor being tied together--so the BLDC motor isn't actively trying to hold a specified torque during each test. That will have to come at a later date!

I did run into some issues with the Bitscope USB oscilloscope interfering with my Riden power supply, so with $$$ and a lot of PyVisa assistance from Thebrakshow, I have a new Siglent SDS1104X-E oscilloscope integrated into the stepper tester. Instead of 12000 samples per plot, we can capture over 500,000! Part of the fun has been adjusting the scope configuration per test point in order to maximize the resolution.

I started out with the voltage and current on channels 1 and 2, but will be changing them to channels 1 and 3 since the SDS1104X-E can maintain full sample rate on two channels as long as they are split between 1/2 and 3/4! The plot below is still with 1/2 the resolution at higher speed points.


View attachment 496
The other component of this that is important is timing! Since we are looking at potentially hundreds of thousands of test points, the time for each point is critical. I spent some time working on threading the data capture portion of each sequence, since capturing data sequentially takes a long time! Here's an example of 5 test points without threading:

img


And here's the same test points, with threading:

img


Since these tests, the cycle time has increased since I'm capturing more data with the oscilloscope (10k to ~100k-1M samples), but this is a huge improvement nonetheless.

What's next?

Once I have the oscilloscope sampling updated, next step will be to add the encoder feedback! This will be the most reliable way to determine when the motor has stalled. Then, I want to work some more on data processing. With even the current setup, so much data is being generated that having graphs auto generated per data point (oscilloscope plots) as well as summaries per motor (current/power vs. speed and voltage) will be critical to save time. At that point, I'll likely try and do some bigger test sweeps and present the data I have!

The final big piece is still the BLDC torque conttrol--that will be another big effort :) but that's for another day.

Thanks Eddie for share, it's absolutely great knowledge, hope next one is LDO Stepper on.
 
Top